 |
|
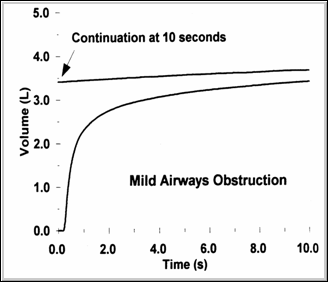
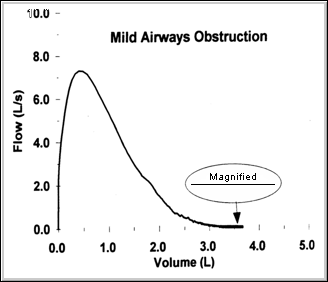
- Airflow obstruction may be the result of inflamation in the airway lumen, constriction of bronchial smooth muscle or due to airways collapse due to a loss of lung elasticity as occurs in COPD/emphysema. This dynamic collapse of the airways occurs during exhalation and is accentuated by forced efforts.
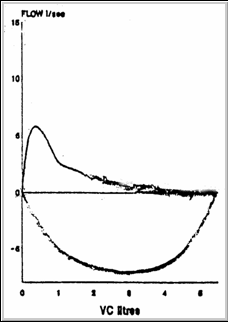
- The figure on the left illustrates an inspiratory and expiratory flow/volume curve where severe obstruction is present. Note that the inspiratory limb has a normal appearance. The expiratory limb has a low peak flow indicating obstruction or dynamic collapse of some mid-sized conducting airways, there is pronounced scooping of the curve and a prolonged terminal period of low flow as air moves out of the high resistance, diseased smaller conducting airflows.
|


