 |
| Module 4: Physiology of the Respiratory System - Normal Curves and Patterns of Abnormality. |
 |
| Module 4: Physiology of the Respiratory System - Normal Curves and Patterns of Abnormality. |
 |
 |
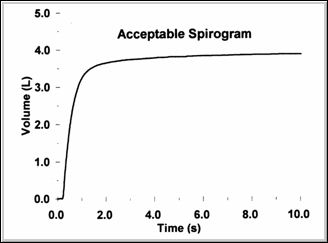
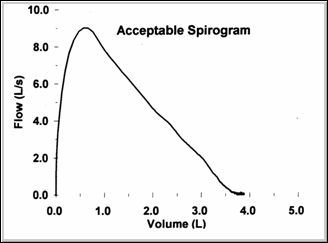
These two figures again illustrate the appearance of equivalent, normal flow/volume and volume/time curves. Note that Peak Flow occurs in the first 25% of exhaled volume on the F/V curve.
The two most important patterns of abnormality detected by spirometry are:
An abnormal spirogram may have a combination of restrictive and obstructive and restrictive abnormalities.
Flow/volume loops, when they measure both a forced expiratory and inspiratory effort are also able to distinguish whether airways obstruction is in the intra- or extra-thoracic airways and whether it is fixed or variable. This is an additional clinical application of flow/volume curves.

Postgraduate Diploma in Occupational Health (DOH) - Modules 3 – 5: Occupational Medicine & Toxicology by Prof Rodney Ehrlich & Prof Mohamed Jeebhay is licensed under a Creative Commons Attribution-NonCommercial-ShareAlike 3.0 Unported License.
Permissions beyond the scope of this license may be available at http://www.healthedu.uct.ac.za/