 |
| BS1.4: Descriptive Measures |
 |
| BS1.4: Descriptive Measures |
OBJECTIVES |
At the end of this section you should be able to compute and interpret the following descriptive measures:
|
Measures of central tendency and dispersion are common descriptive measures for summarising numerical data.
Measures of central tendency are measures of the location of the middle or the center of a distribution. The most frequently used measures of central tendency are the mean, median and mode.
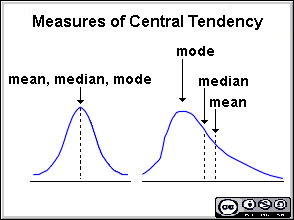
A comparison of the mean, median and mode can reveal information about skewness, as illustrated in figure below. The mean, median and mode are similar when the distribution is symmetrical. When the distribution is skewed the median is more appropriate as a measure of central tendency.

A measure of dispersion is a numerical value describing the amount of variability present in a data set.
The standard deviation (SD) is the most commonly used measure of dispersion. With the SD you can measure dispersion relative to the scatter of the values about their mean.
The range can also be used to describe the variability in a set of data and is defined as the difference between the maximum and minimum values. The range is an appropriate measure of dispersion when the distribution is skewed.
Consider the following blood lead concentration values (mg/dl) among a random sample of male workers exposed to lead over a 5-year period in a battery manufacturing plant: 64, 66, 77, 72, 80, 72, 78, 63, 68, 79. (Click here for information on how to use the calculator (Windows XP))
a) Calculate the measures of central tendency: Mean, Median and Mode:
![]()
To locate the median, data values are ordered: 63, 64, 66, 68, 72, 72, 77, 78, 79, 80.
The median lies between the 5th and 6th value = 72 mg/dl.
Mode: 72 mg/dl.
b) Calculate the measures of dispersion: Range and Standard Deviation
Range: 63 to 80 mg/dl
Standard deviation: 6.42 mg/dl
 |
Interactive Examples**The Examples listed below have been included in order to illustrate the concepts discussed in this Section. |
|
| Question 1 | Question 6 | Question 11 |
| Question 2 | Question 7 | Question 12 |
| Question 3 | Question 8 | Question 13 |
| Question 4 | Question 9 | Question 14 |
| Question 5 | Question 10 | Question 15 |
**These examples work on Internet Explorer
