 |
| Module 3: Toxicology - Section 1: Introduction to Occupational Toxicology |
| TOX 1.9: Toxicodynamics-: Dose-Response Relationships |
 |
| Module 3: Toxicology - Section 1: Introduction to Occupational Toxicology |
| TOX 1.9: Toxicodynamics-: Dose-Response Relationships |
Paracelsus stated that "all substances are poisons; there is none which is not. Only the dose differentiates a poison from a remedy".
One of the basic tenets of toxicology is the dose response relationship which results from measurement of outcomes over various dosages. Dose response tables and graphs typically result from laboratory animal testing over high dose levels.
On relatively rare occasions dose response data can be derived from human toxicity data. Examples include substances commonly associated with human poisoning such as ethyl and methyl alcohols, carbon monoxide, organophosphate insecticides, heavy metals and pharmaceutical agents such as acetamenophen. In determining human risk for chronic disease or diseases with long latency, animal data are necessary and a variety of assumptions made in relating same to human risk.

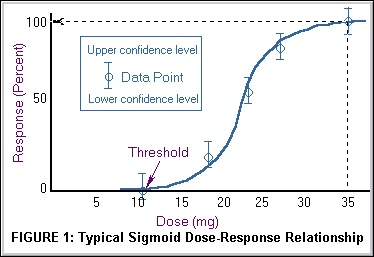
Figure 1, above displays the typical sigmoid curve of the percent of observed subjects (laboratory animals), with evidence of a toxic effect over the different dosages studied. Note that response here means the percentage of subjects affected in a defined way (e.g. death). (Dose-effect curves refer to the spectrum of effects experienced by subjects at different doses, e.g. mild euphoria at low dose, loss of coordination at medium doses, coma at high doses, for a neurotoxin) Although the dosage scale on the x axis below is displayed on a linear scale dose, it is often displayed logarithmically.
In general, the higher the dose, the more severe the response. For most effects, small doses are not toxic. Most physiologic responses follow a sigmoidal or "S" shaped curve, with an initially low slope of incremental response with increasing dose which increases to a maximal slope in the mid dose range and plateaus again to a low slope at maximal range.
The dose-response relationship or curve allows one to establish that a chemical has induced the observed effects, helps establish the lowest dose at which toxicity occurs if there is a threshold, and determines the rate or slope for the dose response relationship. There may or may not be a threshold, a dose below which no observable effect is expected. In the hypothetical curve above in Figure 1 , no toxicity occurs at 10 mg whereas at 35 mg 100% of the individuals experience toxic effects.

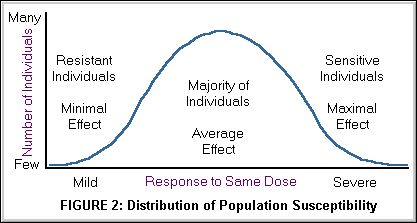
Within a species or population, the majority will respond similarly to a given toxicant; however, a wide variance of responses may be encountered, as some individuals are susceptible and others resistant. As demonstrated in Figure 2 above, a graph of the individual responses can be depicted as a bell-shaped standard distribution curve. Figure 2 is identical to Figure 1 above except that the y axis was changed from the cumulative percentage of subjects responding over a dose range to the simple percentage of the of subjects responding at each dose studied.

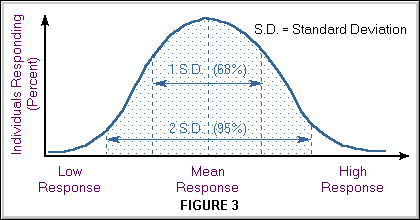
Figure 3 above, displays the relationship between standard deviation of the response and the subset of the population responding within that dose range. Dose responses are commonly presented as mean + 1 or 2 S.D. (standard deviation), which represent 68% or 95% of the individuals respectively. A large standard deviation indicates great variability of response. For example, a response of 15+8 mg indicates considerably more variability of response than 15+2 mg.
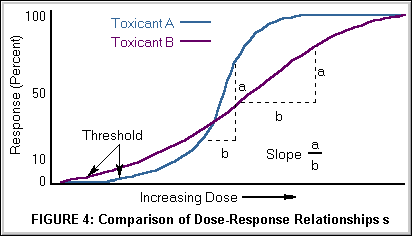
The shape and slope of the dose-response curve is helpful in predicting the risk or toxicity of a substance at specific dose levels. Major differences among toxicants may exist not only in the dose at which the toxicity is seen but also in the percent of population responding per unit change in dose (i.e., the slope). As illustrated in Figure 4 below, Toxicant A has a higher threshold but a steeper slope than Toxicant B, the implication being that comparatively, Toxicant B is more toxic at lower dosages and Toxicant A more toxic at higher dosages.
A threshold for toxic effects occurs at the point where the body's ability to detoxify a xenobiotic or repair toxic injury has been exceeded. For most organs there is a reserve capacity so that loss of some organ function does not cause decreased performance.

The threshold may also be referred to as the LOAEL, Lowest Observed Adverse Effect Level or NOAEL, No Observed Adverse Effect Level.

Postgraduate Diploma in Occupational Health (DOH) - Modules 3: Occupational Medicine & Toxicology (Basic) by Profs Mohamed Jeebhay and Rodney Ehrlich, Health Sciences UCT is licensed under a Creative Commons Attribution-Noncommercial-Share Alike 2.5 South Africa License. Major contributors: Mohamed Jeebhay, Rodney Ehrlich, Jonny Myers, Leslie London, Sophie Kisting, Rajen Naidoo, Saloshni Naidoo. Source available from here. For any updates to the material, or more permissions beyond the scope of this license, please email healthoer@uct.ac.za or visit www.healthedu.uct.ac.za.
Last updated Jan 2007.
Disclaimer note: Some resources and descriptions may be out-dated. For suggested updates and feedback, please contact healthoer@uct.ac.za.