 |
| BS1.6: Confidence Intervals |
|
| BS1.6: Confidence Intervals |
OBJECTIVES |
At the end of this section you should be able to:
|
Statistical inference is the process of using samples to make inferences about a population. Usually it is not possible to study the entire population. In most sample surveys we do not know the true population measure, we can only infer from our "sample statistic", also referred as a point estimate.
Suppose the mean systolic blood pressure among a sample of 49 truck drivers is 130 (mm Hg).
This sample mean is called a point estimate, and it is used to estimate the corresponding population mean.
There are two main areas of statistical inference, Estimation and Hypothesis testing.
If repeated samples are taken from the same population there is no reason to assume that the population mean will be exactly equal to the sample mean. The degree of variation between means from repeated samples can be measured by the standard error of the mean (SEM).

Where S = standard deviation and n = sample size.
It would be much more meaningful to calculate limits between which the population mean is likely to lie with a specific degree of confidence. This is called an interval estimate
The CI gives a range around the mean where we expect the "true" (population) mean to lie, using the formulae:

The above interval is called the 95% confidence interval (CI) for a population mean.
Note that the width of the CI depends on the sample size and on the variation of data values. A very wide interval may indicate that more data should be collected before anything very definite can be said about the population mean.
The interval (mean ± 2 SEM) is applicable for
Suppose the mean systolic blood pressure among a sample of 49 truck drivers employed in a transporting company "A" is 130 (mm Hg) with SD = 21. The 95% CI for the population mean is:
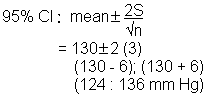
Interpretation: We are 95% confident that the population mean lies within this interval.
Suppose the mean systolic blood pressure among the general population is 120 (mm Hg). This value lies outside of the above 95% confidence interval (124 ; 136), suggesting that the mean systolic blood pressure among truck drivers employed in transport company "A" is significantly higher than the general population mean.
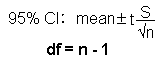
For smaller samples (n < 30) the formulae for calculating the 95% CI for a population mean is:

The value for t is derived from the t-distribution table with varying degrees of freedom (n-1).
Like the normal distribution, the t-distribution is a symmetrical bell-shaped distribution. The exact shape of the t-distribution depends on the degrees of freedom (df). The smaller the sample, the more the t-distribution is spread out. One of the assumptions underlying the valid use of the t-distribution is that the sampled population be normally distributed.
Suppose the mean systolic blood pressure among a sample of 25 truck drivers (n<30) employed in transporting company "A" is 130 (mm Hg) with SD = 20. The 95% CI for the population mean is:
To derive the value for t, click on t-distribution table. Look up degrees of freedom (n-1) = 24.
The corresponding t-value under P = 0.05 column is t = 2.064.
95% CI = 130 ± 2.064 (4)
= 130 ± 2.064 (4)
= (130 - 8.256); (130 + 8.256)
= 121.7 ; 138.3 (mm Hg)
Interpretation: We are 95% confident that the population mean lies within this interval.
To estimate a population proportion we proceed in the same manner as when estimating a population mean. If p is the observed proportion the 95% CI is:

Suppose the prevalence of smoking among a sample of 100 women farm workers in the Western Cape is 20%. The 95% CI for the population proportion is:
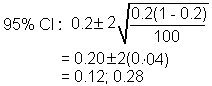
Interpretation: We are 95% confident that the population proportion lies between 12% and 28%.
Standard error measures the precision of estimates.
Standard deviation measures the variability of distributions.
If you want to show how good your estimate of the mean is, you calculate the SEM.
If you want to show how widely scattered your measurements are, you calculate the SD.
![]()
![]()
![]()
