 |
| Block 8: Environmental Issues and Public Health - Air Pollution Chapter 3: The Main Air Pollutants; Their Health Impacts; Exposure - Response Relationships (Continued) |
The negative health impacts of exposure to suspended particulate matter are due to several complex factors that are still the subject of considerable research. These factors include the size range of the particles, the chemical composition of the particles and the concentration of the particles.
 |
 |
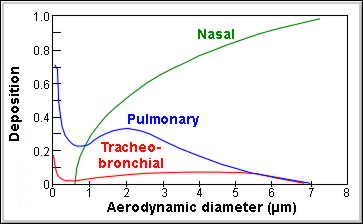
| Figure 3-7: Fractional deposition of particulate matter in the lung, by particle size. |
|
 |
|
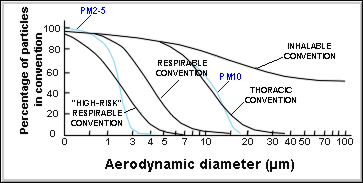
| Figure 3-8: Figure 3-8: Curves defining inhalable, thoracic and respirable particles |
Nature and Sources of the Pollutant:Particulate matter is the term for solid or liquid particles found in the air. Some particles are large or dark enough to be seen as soot or smoke. Others are so small they can be detected only with an electron microscope. Because particles originate from a variety of mobile and stationary sources (diesel trucks, woodstoves, power plants, etc.), their chemical and physical compositions vary widely. Particulate matter can be directly emitted or can be formed in the atmosphere when gaseous pollutants such as SO2 and NOx react to form fine particles. Figure 2.1 show the very wide size range of ambient air particles - the largest particles are due to windblown dust, the smallest particles are formed as secondary pollutants, directly emitted (primary) particles are predominantly from combustion sources. |
Note: PM10 and PM2.5 are the particle size fractions with median diameters of 10 and 2.5 microns (10-6 m) respectively. The expected size distributions of these particle size fractions are shown in Figure 4.3. |
The smaller particles that are likely responsible for adverse health effects because of their ability to reach the lower regions of the respiratory tract. The PM-10 standard includes particles with a diameter of 10 micrometers or less (one-seventh the width of a human hair). Major concerns for human health from exposure to PM-10 include: effects on breathing and respiratory systems, damage to lung tissue, cancer, and premature death. The elderly, children, and people with chronic lung disease, influenza, or asthma, are especially sensitive to the effects of particulate matter. Acidic PM-10 can also damage human-made materials and is a major cause of reduced visibility in many parts of the U.S. New scientific studies suggest that fine particles (smaller than 2.5 micrometers in diameter) may cause serious adverse health effects.
Comparatively recent data indicates that much of the health impact ascribed to PM10 is in fact caused by the PM2.5 size fraction, sometimes termed the ‘fine fraction’. The increased harm caused by PM2.5 (relative to its mass fraction) is ascribed to it penetrating deeper into the lungs compare with the coarse fraction (PM10 minus PM2.5), to its more harmful chemical composition (sulphates, nitrates and transition metals such as iron) and the far greater surface area per unit mass compared with the coarse fraction.
Suspended particulate matter:
Health effects of SPM in humans depend on particle size and concentration, and can fluctuate with daily fluctuations in PM10 or PM2.5 levels. They include acute effects such as increased daily mortality, increased rates of hospital admissions for exacerbation of respiratory disease, fluctuations in the prevalence of bronchodilator use and cough and peak flow reductions. Long-term effects of SPM refer also to mortality and respiratory morbidity, but only few studies on the long-term effects of SPM exist. Air pollution by particulate matter has been considered to be primarily an urban phenomenon, but it is now clear that in many areas of developed countries, urban-rural differences in PM10 are small or even absent, indicating that PM exposure is widespread. This is not to imply that exposure to primary, combustion-related PM may not be higher in urban areas.
A variety of methods exist to measure different fractions of particulate matter in air, with different health significance (see Section 2.1.1). This evaluation has tended to focus on studies in which PM exposure was expressed as PM10 and PM2.5. Health effect studies conducted with various TSP and BS as exposure indicators have provided valuable additional information. However, they are less suitable for deriving exposure-response relationships for PM because TSP includes particles that are too large to be inhaled, or because the health significance of particle opacity as measured by the Black Smoke method is uncertain. Methods for measuring particle concentrations are discussed in section 5.7.
The current time-series epidemiological studies are unable to define a threshold below which no effects occur. Recent studies suggest that even at low levels of PM (less than 100 µg/m3 ), short-term exposure is associated with health effects. At low levels of PM10 (0 - 100 µg/m3), the short-term exposure-response curve fits a straight line reasonably well (Figures 3.6 to 3.8). However, there are indications from several studies that at higher levels of exposure (several hundreds of µg/m3 of PM10), at least for effects on mortality, the curve is flatter than at low levels of exposure. This is discussed later in this section.
Although many studies have obtained acute effect estimates for PM10 that are reasonably consistent, this does not imply that particle composition or size distribution within the PM10 fraction is unimportant. Limited evidence from studies on dust storms indicates that such PM10 particles are much less toxic than those associated with combustion sources. Recent studies in which PM10 size fractions and/or constituents have been measured suggest that the observed effects of PM10 are largely associated with fine particles and not with the coarse fraction (PM10 minus PM2.5). In some areas strong aerosol acidity or sulphate may be the cause of the effects associated with PM2.5.
Evidence is also emerging that long-term exposure to low concentrations of PM in air is associated with mortality and other chronic effects, such as increased rates of bronchitis and reduced lung function. Two cohort studies conducted in the U.S.A. suggest that life expectancy may be 2-3 years shorter in communities with high PM than in communities with low PM. This is consistent with earlier cross-sectional studies, which compared age-adjusted mortality rates across a range of long-term average PM concentrations. The results showed that long-term average exposures to low PM levels, starting at about 10 µg/m3 of fine particulate matter, were associated with a reduction in life expectancy. Whilst such observations require further corroboration, preferably also from other areas in the world, these new studies suggest that the public health implications of PM exposure may be large.
Figures 3.6-3.8 show summary estimates of the relative increase in various health parameters as a function of PM concentration. These figures are based on data reported in studies in which PM10 and/or PM2.5 have been measured. They were not inferred from other measures such as Coefficient of Haze, Black Smoke or SPM. The database for parameters other than PM10 is still limited, so the evaluation of health effects, especially the short-term effects, is largely expressed in terms of PM10. However, future regulations and monitoring activities should give emphasis to the ultrafine and fine fractions in addition to, or even instead of, PM10.
The following issues should be considered when using these graphs: