 |
| LUNG FUNCTION PRACTICAL: INTERPRETING THE SPIROMETRY DATA |
|
| LUNG FUNCTION PRACTICAL: INTERPRETING THE SPIROMETRY DATA |
The observed FEV1/FVC is expressed as a percentage and the lower limit of normal (LLN) is defined as 70%. FVC and FEV1 are based on percent predicted (%pred) and LLN defined as 80%. BD = Bronchodilator.
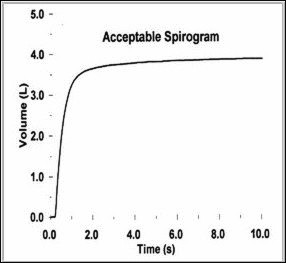
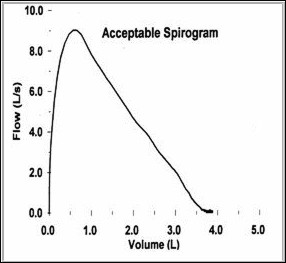
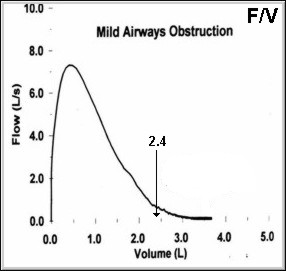
The diagrams below show acceptable spirometric curves. On the left, a volume/time (V/T) curve, and on the right, a flow/volume (F/V) curve.
 |
 |
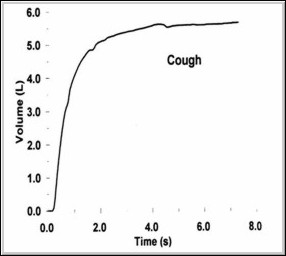
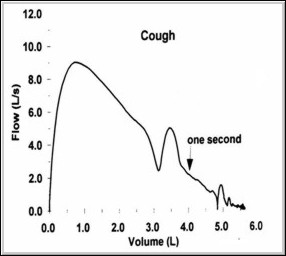
Certain artefacts, such as coughs, render the spirometric curves unacceptable. The diagrams below show the effect of a cough. On the left, a volume/time (V/T) curve, and on the right, a flow/volume (F/V) curve.
 |
 |
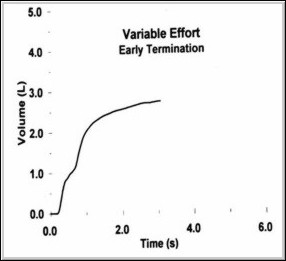
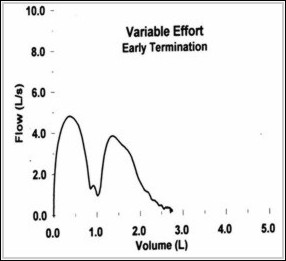
Note from GRD: We should define "variable effort". On the left, a volume/time (V/T) curve, and on the right, a flow/volume (F/V) curve.
 |
 |
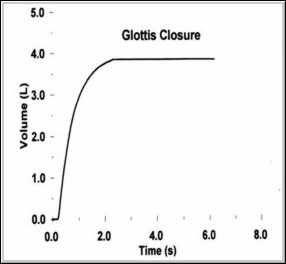
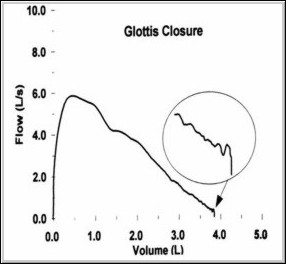
Glottis closure results in premature termination of effort and reduced observed FVC. On the left, a volume/time (V/T) curve, and on the right, a flow/volume (F/V) curve.
 |
 |
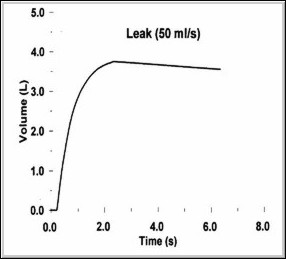
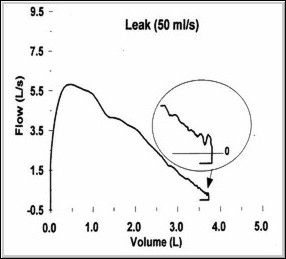
Unacceptability due to air leaks. On the left, a volume/time (V/T) curve, and on the right, a flow/volume (F/V) curve.
 |
 |
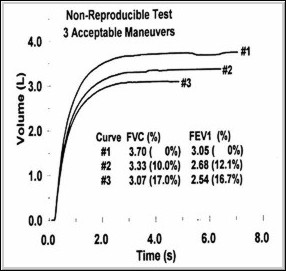
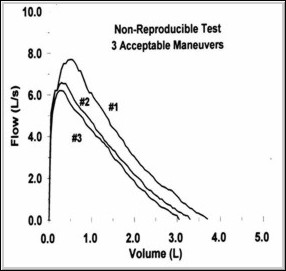
The curves below demonstrate non-reproducible results:
 |
 |
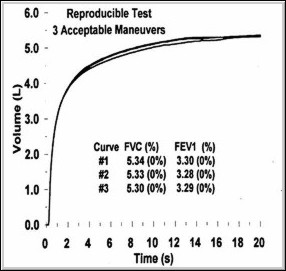
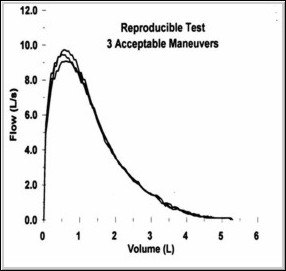
while the two curves below show reproducibility, and are therefore acceptable:
 |
 |
Needs some explaining. The legend in the ellipse on the right is illegible, even when I zoom the original.
 |
 |
Note from GRD: Can we amplify/explain what this means?
![]()
![]()
![]()