 |
| LUNG FUNCTION PRACTICAL: INTERPRETING THE SPIROMETRY DATA |
 |
| LUNG FUNCTION PRACTICAL: INTERPRETING THE SPIROMETRY DATA |
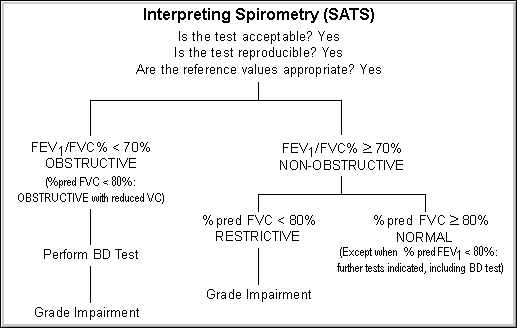
The observed FEV1/FVC is expressed as a percentage and the lower limit of normal (LLN) is defined as 70%. FVC and FEV1 are based on percent predicted (%pred) and LLN defined as 80%. BD = Bronchodilator.
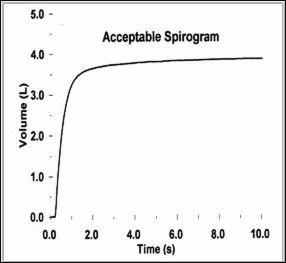
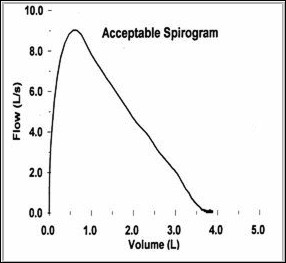
The diagrams below show acceptable spirometric curves. On the left, a volume/time (V/T) curve, and on the right, a flow/volume (F/V) curve.
 |
 |
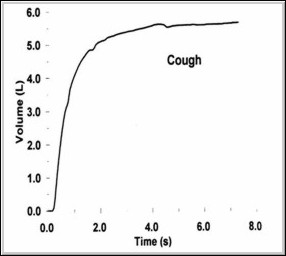
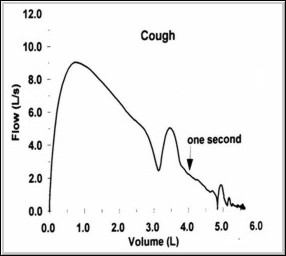
Certain artefacts, such as coughs, render the spirometric curves unacceptable. The diagrams below show the effect of a cough. On the left below, a volume/time (V/T) curve, and on the right below, a flow/volume (F/V) curve.
 |
 |
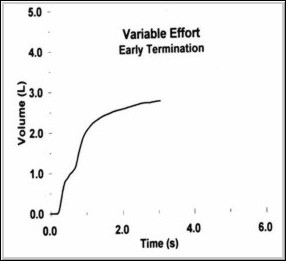
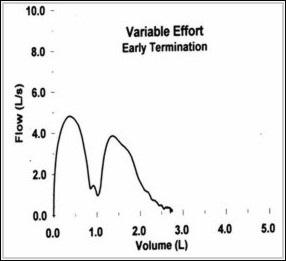
Variable effort occurs when the forced exhalation is not constant, and is best seen on the (F/V) curve. On the left below, a volume/time (V/T) curve, and on the right below, a flow/volume (F/V) curve.
 |
 |
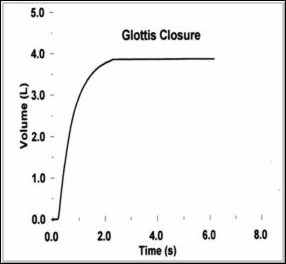
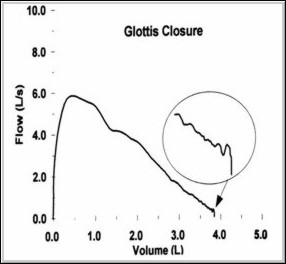
Glottis closure results in premature termination of effort and reduced observed FVC. On the left below, a volume/time (V/T) curve, and on the right below, a flow/volume (F/V) curve. The end of the F/V curve does not end almost horizontal, but ends vertically and abruptly.
 |
 |
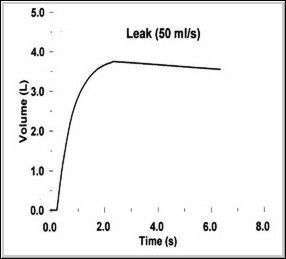
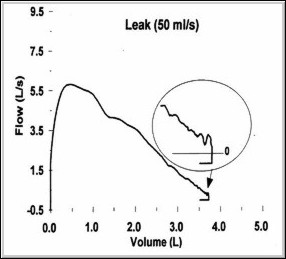
Unacceptability due to air leaks. On the left below, a volume/time (V/T) curve, and on the right below, a flow/volume (F/V) curve.
 |
 |
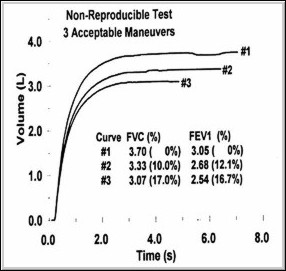
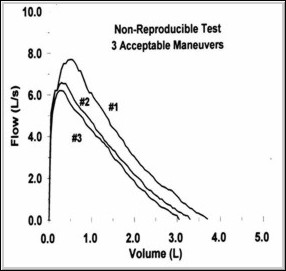
The curves below demonstrate non-reproducible results:
 |
 |
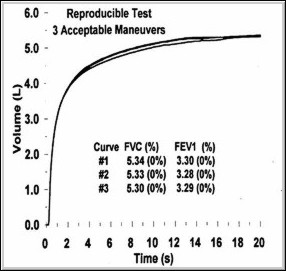
while the two curves below show both reproducibility and acceptablity:
 |
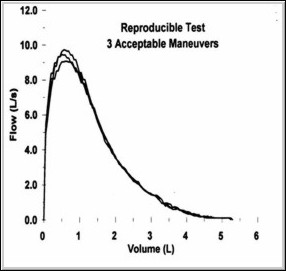 |
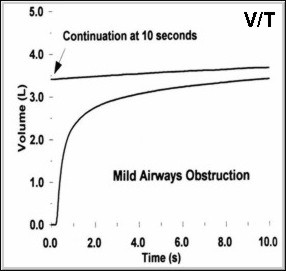
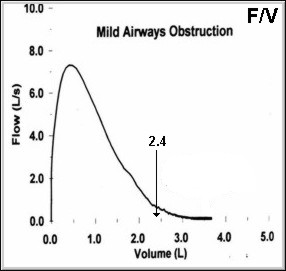
The loop (F/V curve) shows a good crisp start, early peaking, smooth downslope, and an acceptable end by approaching the baseline horizontally. Airways obstruction is suspected by the typical shape of each curve: the V/T curve is still rising at 6 seconds (instead of plateau-ing out horizontally), and the F/V curve is scalloped as it approaches the volume achieved in the first second, which in this case is ~ 2.4 litres.
 |
 |
The percentage reversibility of airways obstruction after using a brochodilator is defined as: