 |
| BS1.9: Comparison of two Means |
|
| BS1.9: Comparison of two Means |
OBJECTIVES |
At the end of this section you should be able to:
|
| A two-sample t-test is a hypothesis test for answering questions about the significant difference between two sample means collected from two independent samples. We calculate the t-test by subtracting the hypothesized value, (Mean1 - Mean2), and then divide this difference by the standard error for the difference between the means. | 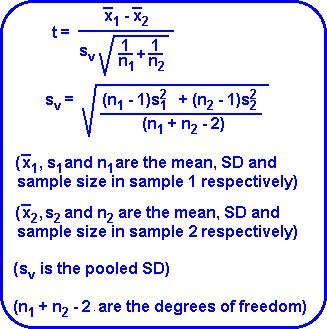 |
Note: The assumptions underlying the valid use of the t-test is that the sampled population(s) be "Normally" distributed and that their standard deviations are approximately similar.
We reject the null hypothesis when the probability of its occurrence is less than or equal to 0.05 (P Ł0.05) and the P-value is said to be "significant".
To obtain the P-value we first need to calculate the t-test value and compare this to the t-distribution value (table) at (n1 + n2 - 2) degrees of freedom.
Suppose a researcher wish to compare mean systolic blood pressure values between two groups (exposed and non-exposed). The following descriptive measures were computed:
| Descriptive measures | Sample #1 (Exposed) |
Sample #2 (Non-exposed) |
|---|---|---|
| Sample size | 15 | 12 |
| Mean systolic BP (mm Hg) | 130 | 120 |
| Standard deviation | 22 | 20 |
We apply the t-test formulae above to determine whether the two means are significantly different.
t = (130-120) / 8.19
t = 1.22
Degrees of freedom = 25.
To obtain the corresponding P-value: Click on t-distribution table and look up 25 degrees of freedom. The calculated t-value (1.22) lies between the P-values 0.5 and 0.1.
Interpretation: Since the corresponding P-value is greater than 0.05 (P > 0.05), we do have sufficient evidence to reject the null hypothesis, suggesting that the mean systolic blood pressure values between exposed and non-exposed are not significantly different.
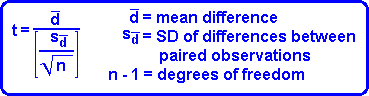
A paired sample t-test is used to determine whether there is a significant difference between the paired observations made under two different conditions. For example, between pre and post or before and after measurements are made on each unit in a sample. The test is based on the paired differences between these two values. The test statistic for testing the hypothesis about population mean differences is:
In a pilot survey the following scores were recorded before and after an AIDS awareness program. Ten workers were selected randomly from a battery manufacturing plant.
A higher score indicates greater knowledge.
| Scores before | Scores after | Difference |
|---|---|---|
| 10 | 13 | 3 |
| 16 | 17 | 1 |
| 13 | 15 | 2 |
| 8 | 10 | 2 |
| 14 | 15 | 1 |
| 11 | 12 | 1 |
| 12 | 16 | 4 |
| 13 | 17 | 4 |
| 9 | 14 | 5 |
| 10 | 10 | 0 |
| Mean | 2.3 | |
| S.D. | 1.6 |
We apply the paired t-test formulae above to determine whether knowledge about AIDS increased significantly after an AIDS awareness program.
t = 2.3 / [0.51]
t = 4.5
Degrees of freedom = 9.
To obtain the corresponding P-value: Click on t-distribution table and look up 9 degrees of freedom. The calculated t-value (4.5) lies between the P-values 0.01 and 0.001
Interpretation: Since the corresponding P-value is less than 0.05 (P<0.05), we reject the null hypothesis, suggesting that the scores are significantly higher after an AIDS awareness program.
![]()
![]()
![]()
