 |
| BS1.11: Pearsonís Correlation |
 |
| BS1.11: Pearsonís Correlation |
OBJECTIVES |
At the end of this section you should be able to:
|
The purpose of the Pearson's correlation statistic is to measure the degree of association between numerical variables.
For example the relationship between blood pressure (Y) and body mass index (X). The Pearson's correlation coefficient is denoted by r and is on the scale that varies from +1 through to 0 to -1.
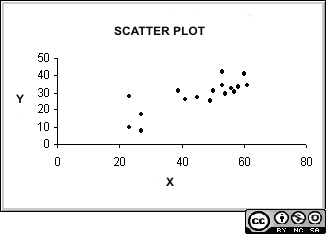
Scatter diagram:A first step in studying the relationship between two numerical variables is to produce a scatter diagram. The points plotted usually suggest the basic nature and strength of the relationship between two variables. The Figure on the right is an example of a scatter plot between the variables X (independent variable) and Y (dependent variable) |
 |
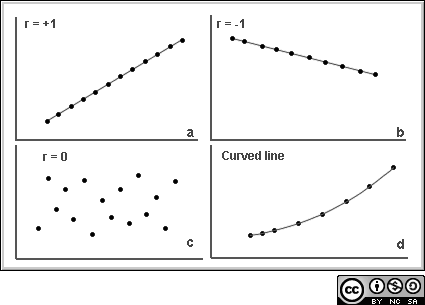
Regression analysis is helpful in ascertaining the probable form of the relationship between variables. The ultimate objective is to predict the value of one variable corresponding to a given value of another variable. The Figures below illustrate scatter diagrams for different values of the correlation coefficient and regression lines.

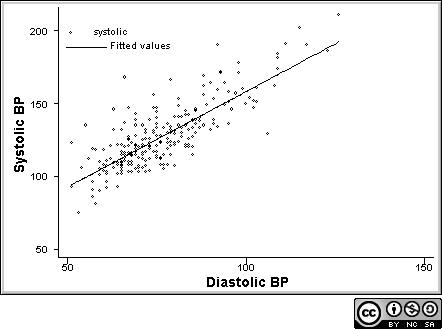
The diagram below depicts a scatter plot between systolic and diastolic blood pressure measurements with predicted values on the line defined by the regression equation:

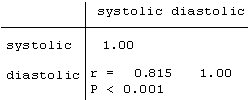
| The above output shows a significant correlation between systolic and diastolic blood pressure measurements. The Pearsonís correlation r = 0.8015 is close to 1. |  |
